There isn’t anything of particular interest in the server-error.log and in the server-out.log I see the following:
ws not alive 10.0.0.34
ws not alive 10.0.0.34
ws not alive 10.0.0.34
ws not alive 10.0.0.34
ws not alive 10.0.0.34
ws not alive 10.0.0.34
ws not alive 10.0.0.34
ws not alive 10.0.0.34
ws not alive 10.0.0.34
ws not alive 10.0.0.34
ws not alive 10.0.0.34
Error: connect ETIMEDOUT 10.0.0.34:81
    at TCPConnectWrap.afterConnect [as oncomplete] (node:net:1278:16)
    at TCPConnectWrap.callbackTrampoline (node:internal/async_hooks:130:17) {
  errno: -110,
  code: 'ETIMEDOUT',
  syscall: 'connect',
  address: '10.0.0.34',
  port: 81
}
ws not alive 10.0.0.34
stopping 10.0.0.34
ws not alive 10.0.0.34
ws not alive 10.0.0.34
ws not alive 10.0.0.34
ws not alive 10.0.0.34
ws not alive 10.0.0.34
ws not alive 10.0.0.34
ws not alive 10.0.0.34
ws not alive 10.0.0.34
ws not alive 10.0.0.34
I’ve got some PRs up on GitHub ![]() working on another. In the meantime, are there some places in the
working on another. In the meantime, are there some places in the controller.js or discovery.js that I could spit out to the log to help troubleshoot?
This device (10.0.0.34) is the PB with the SB connected and is currently not resolvable in my network. I’ll have to unplug the device to get responsive again physically, but the LED light is online and steady, which has piqued my curiosity to get it sorted out. However, the discoveries.map() does render the “downed” PB in the UI found in its state.
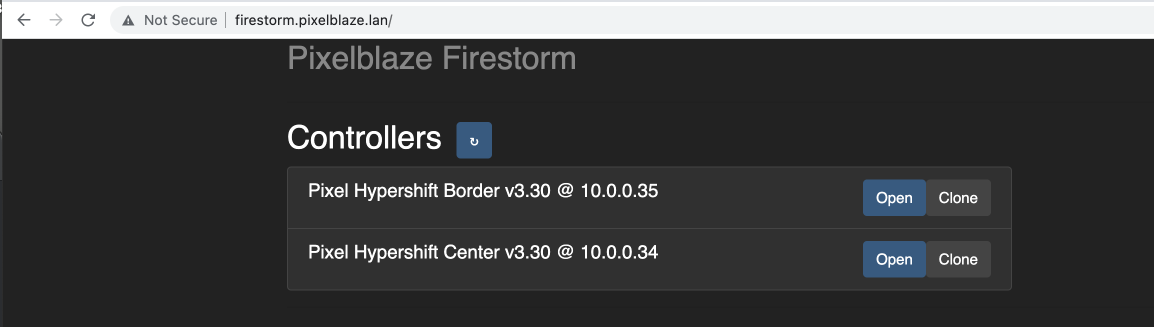
The other device, 10.0.0.35, is still resolvable on the network and is a Pico PB. I disconnected the other standard PB and pico PBs from my networking to assist in troubleshooting. So I only have two listed here.
I am running the branch in PR #44 related to ticket #25 on the repo, which is stable, and no substantial changes to the app/* (API files).
Thanks for the response!
EDIT: I restarted the server to see if I could get something different and the logs again nothing really interesting in the server-error.log but the server-out.log shows
0|server   | ws not alive 10.0.0.34
0|server   | ws not alive 10.0.0.34
0|server   | listening on 80
0|server   | > Pixelblaze Discovery Server listening on 0.0.0.0: 1889
0|server   | done
0|server   | data: [ { id: 9, name: 'rainbow fonts', duration: 15 } ]

0|server  | connected to 10.0.0.35
0|server  | sending to 10225758 at 10.0.0.35 {"getConfig":true,"listPrograms":true,"sendUpdates":false}
0|server  | ws not alive 10.0.0.34
0|server  | ws not alive 10.0.0.34
0|server  | ws not alive 10.0.0.34
0|server  | ws not alive 10.0.0.34
0|server  | ws not alive 10.0.0.34
0|server  | ws not alive 10.0.0.34
0|server  | ws not alive 10.0.0.34
0|server  | ws not alive 10.0.0.34
and the UI in the disoveries.map() is the following:
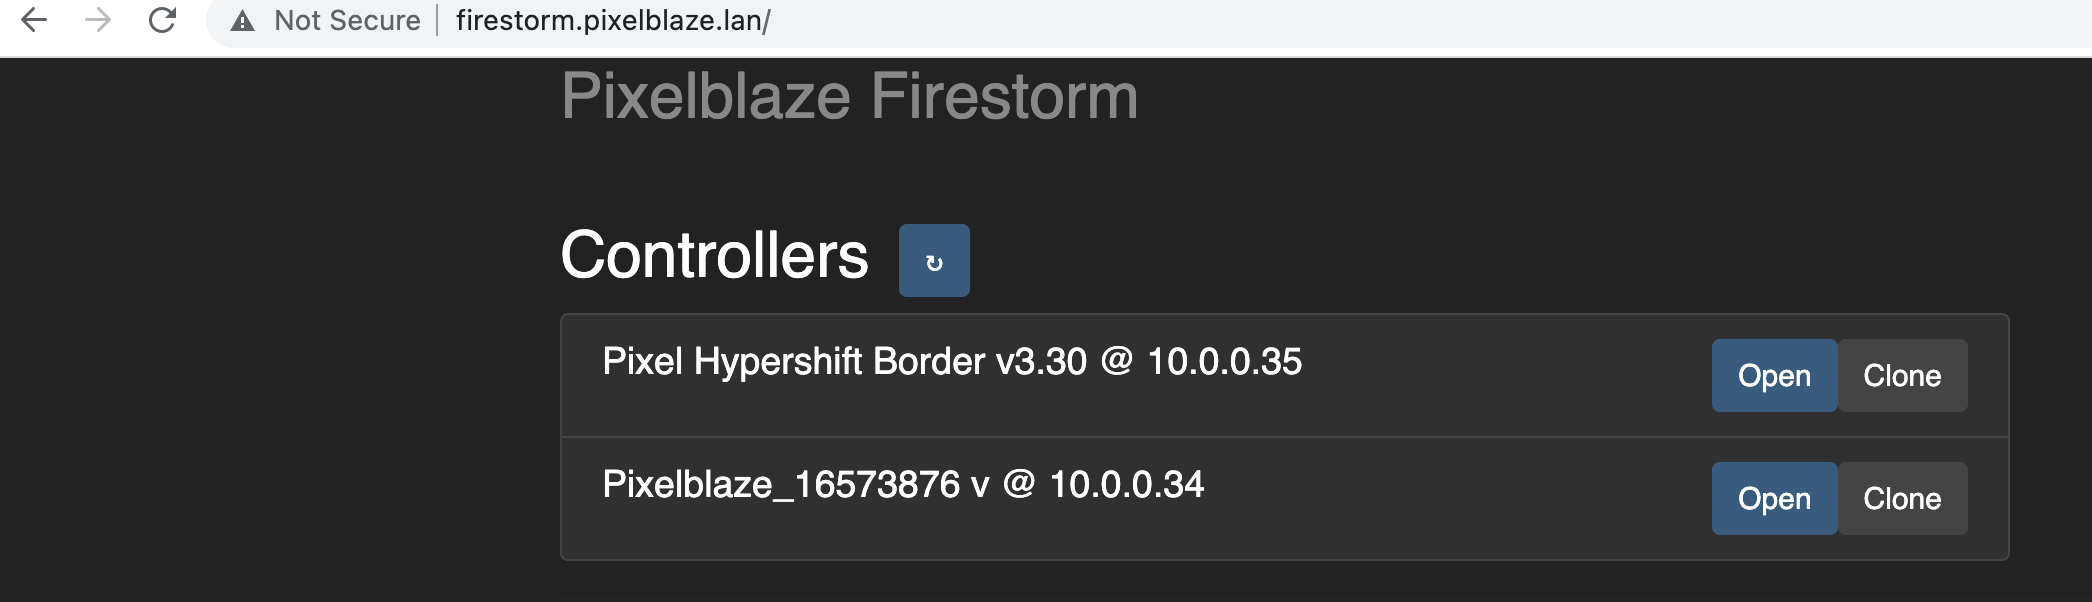
It is odd that it just rendered the HW name and nothing else…
if I try to dump from the device via Firestorm (the code suggests I should be able to by hitting /), I don’t get any zip or anything, just a weird downloaded HTML page that isn’t found… perhaps this is a bug in the UI that needs to be addressed later.