Looking for help with LED grid design

I am installing a grid of WS2812b strips underneath a shelf over my office desk. I just started to think about the strategy for this. I’m curious to see what your thoughts are about the implementation of this from the controller to the wiring and the code.

I already ordered a PixelBlaze V2 and the output expander, as well as the sensor breakout and a whole bunch of LED strips and wiring. I’m already comfortable with splitting/soldering the strips and general use of the PixelBlaze controller.

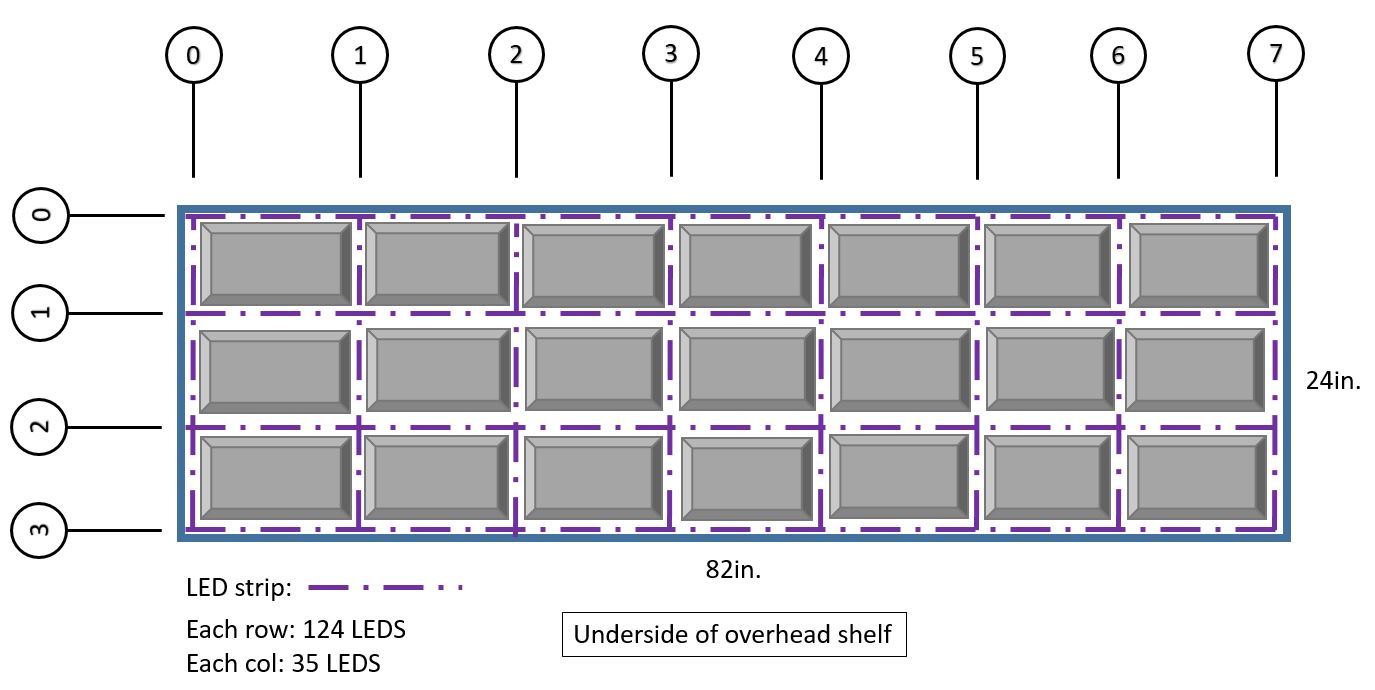
Between each strip will be acoustic foam panels, with a 1/2in gap to allow the light to shine down between the foam panels. I’m hoping to animate this grid as if it were a section from a huge 2D panel. This would provide a relationship between the pixels such that an animation, like an underwater shimmer, or moving shapes would have continuity across the entire grid.

How should I start to go about this?

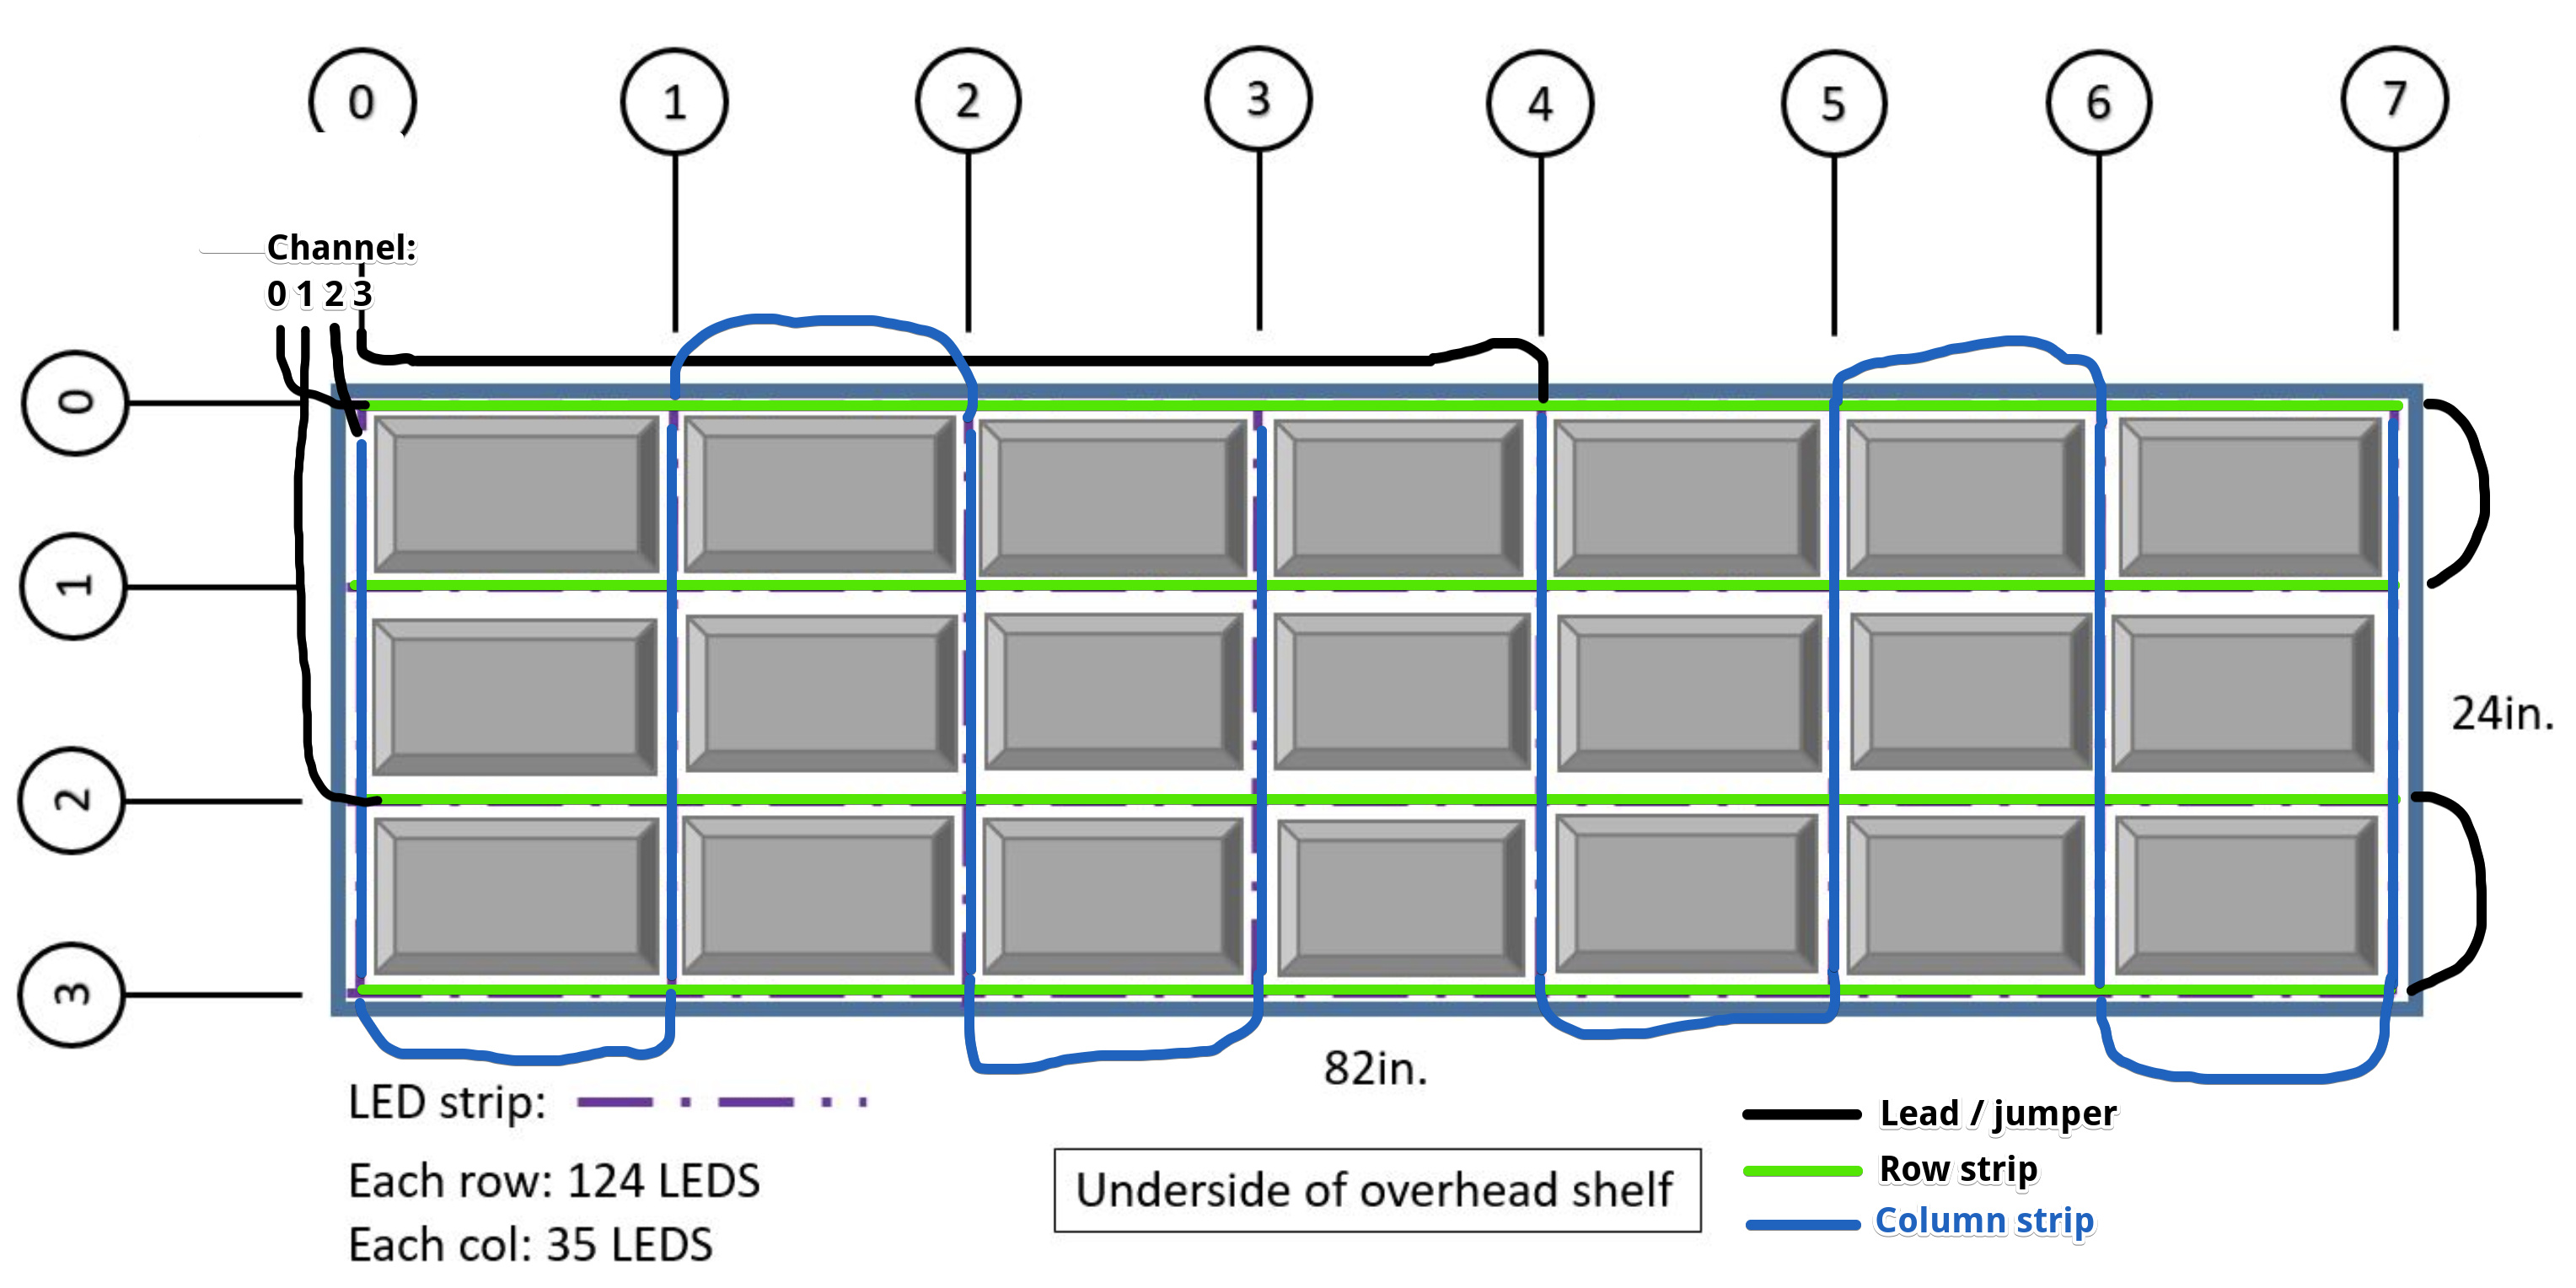
The first pressing question is how to wire up the strips? Should they all be in series on the same data line, or should I use the output expander to break them up into separate data lines? If they are all on the same line, how to I deal with the data line voltage drop?

Here is a diagram of the layout (Updated with foam panels shown)

Hey John!

How clean do you need the install to look? For example, will you be able to see the LEDs directly or are the foam panels thick enough that you’re only seeing diffuse light?

My bias is always towards cutting corners to do less wiring, so I tend to over-optimize for that. With that off my chest, here’s one way. I’ll refer to your diagram in (x,y) where y is positive going down, which is incidentally how the Pixelblaze mapper works and your diagram is conveniently labeled as well. I’m assuming you’ll write your patterns with render2D() using the mapper, so wiring doesn’t matter and is abstracted away from the pattern code.

I’m assuming these are RGB, not RGBW. Each channel on the v1 expander board can handle 240 RGB pixels (800 on the new APA102 compatible one), and I’m assuming that running max 240 pixels per channel is fine in that we won’t have to worry about a voltage drop on any data line. It can supply 3A, so I’d be doing separate math for how I’m going to run power to the whole installation, but I’d assume I can power it fine from one end of each strip at 240 pixels per strip.

A typical full length of 60LED/m is 4 meters, so 240 per spool. Therefore, the first corner I’d cut is: My rows would be 120 LEDs instead of 124. Two spools makes four rows. I’d cut each spool in half and run channel 0 from (0,0) to (0,7), wire an 8in 3-conductor jumper, and wire the second half in series from (7,1) to (0,1). The next channel, channel 1, I’d do from (0,2) to (7,2), jumper, (7,3) to (0,3). Then the rows are done, in 2 channels.

I tend to be lazy and sloppy when it’s just for me, so if this is for a client, the following might not be clean enough of an install. But, if you’re as lazy as me, you’ll be looking to do all the columns with just two 4m strips, without any cutting and only soldering each strip once. That means a zigzag from (0,0) to (3,0), and another from (4,0) to (7,0). Three approaches to the footlong overlaps with the rows: 1. Just overlap, especially if the actual pixels aren’t visible. Sort it out in the mapper. 2. Cover those segments with opaque black shrink tubing. 3. If the surface everything is being mounted to can be through-holed, consider lacing it through to the back for the row segments.

And if you’re not lazy, or want it cleaner, you could just splice in a bunch of 12 inch jumpers.

Either way, you’re looking at just 4 expander channels for all rows and columns, I think.

Hope this helps!

Jeff

1 Like

I like your efficient approach to that if I’m visualizing it right. I might draw some wires on the diagram. I’m not familiar with the 2D mapper. Is that used to tell the controller which pixels are where in space? If so, that would be a really nice way to just wire it up and let the software do the rest.

To our first question: Yes, the strips will be mostly hidden between the acoustic panels, so the light will be “snooted” a bit. The strips will be somewhat visible, but the idea is a super clean install. If needed, I will hide the LEDS with semi-opaque strips.

I ended up just grossly over-ordering on the strips, so I can be crazy OCD about the whole thing and just wire it whichever way is easy to understand.

Yes, the mapper is awesome. There’s a sight learning curve to writing the JS that generates the array of coordinates. Here are the docs that appear in the Pixelblaze interface, and a thread with examples and getting started tips.

Here’s an annotation of what I was proposing for wiring:

1 Like

Ok, that definitely makes sense. Well, I did get the updated the expander which should be able to run 800 pixels per channel, so I’m thinking I may just wire the columns in one channel and the rows in another and see how it holds up. I will at least run the 5v lines to the front and back of each strip to make sure they have enough voltage. Is there any concerns about the length of the data lines?

Sorry, I know other people have had problems with that and needed “extenders” that re-up the data line voltage, but I don’t have a handy rule of thumb, as I usually run the APA102 protocol ones.

Hi @John,
No issue with total data line length if you have LEDs in there. Each LED is a repeater. The general info is 5m between an output and an input, though there are a lot of variables that affect it.

So far so good. Sort of. I made some revisions to the layout for aesthetics, which resulted in only 3 rows. Each row has it’s own voltage (from a 60A Meanwell power supply), so light output is strong.

However, there is a definite (but subtle) color shift within each row. Each strip has a color degradation toward red. In other words, the beginning of each strip displays nice neutral white, but it’s slightly reddish toward the end. The data line is in series across all 3 strips, but the 5V/Gnd are all connected on the left. The weird thing is the color shift correlates to the data line, not the 5V/Gnd line.

I definitely don’t need to pullup the data line voltage, right? I wouldn’t think so since the data line jumper is only about 14" long for each strip. Even that wouldn’t make sense to me because the color at the beginning of each strip is rock solid consistent.

It’s so subtle, I don’t really care actually. It also correlates to the position on the spool, which may explain why these strips only cost $30.

That definitely sounds like voltage drop, which would need more power injection (or thicker wires). I’d test the voltage to see if its lower at the redish parts if possible. I’d also recommend checking for heat buildup, if a strip is carrying a ton of current it can overheat.

If its only slightly noticable at full white, you probably won’t have any color problem when running more interesting patterns.

Woo! I got it working. I couldn’t wrap my head around a script to populate the array I needed, so I just used excel to create the array to hard way. It worked the first time through amazingly.

But now I could use help with a simple pattern to help me understand the 2D rendering. I’d like to have a diagonal line of width (say width = 20) just sweep across the columns and repeat. The grid is mapped as shown in the first picture and the final global dimensions are 30x124. Any thoughts? Thanks for the help guys!

Hi @John,
If you want a sharp edge, something like square() can do that. Here’s a vertical line:

export function render2D(index, x, y) {
  h = 0
  s = 1
  v = square(x - t1, 20/124)
  hsv(h, s, v)
}

To make it diagonal add or subtract y, optionally with some coefficient to change the aspect ratio:

export function render2D(index, x, y) {
  h = 0
  s = 1
  v = square(x + y - t1, 20/124)
  hsv(h, s, v)
}
1 Like

Hey John!

I also played with something similar recently: Here’s an example walking through the thought process of plotting a rotating line:

rotate line

/*
  Point-slope form of a line equation: y-y0 = m(x-x0)
  We'll make the line go through the middle of the mapped matrix: (0.5, 0.5)
  
  Let's animate the slope, m, so the line rotates. We want the slope to go 
  from -∞ to +∞, which happens to be the plot of tan(angle).
  
  Now, how to set the brightness to be high only if a pixel is close to this line?
  
  Wikipedia gives us the distance from a given point to a line:
  https://en.wikipedia.org/wiki/Distance_from_a_point_to_a_line
  
  A little algebra produced me the formula below for any matrix pixel's distance
  from the line. The closer the pixel is, the brighter it should be.
*/

export function beforeRender(delta) {
  angle = time(2 / 65.536) * PI2
  m = tan(angle) // Slope
  m = clamp(m, -180, 180) // Prevent m * m overflow later
}

export function render2D(index, x, y) {
  // distance from this (x,y) pixel to the line going through (0.5, 0.5)
  distance = abs(-m * x + y + (m - 1) / 2) / sqrt(m * m + 1)
  
  // We want it brightest when distance is zero
  v = clamp(0.2 - distance, 0, 1) // 0.1 = line width is 10% of matrix 

  hsv(0, 0, v * v)
}
1 Like

Thanks guys. All of the above worked and helped me get my head around the 2D render. I’m going to have tons of fun with this. I’ll post a pic once the rest of the setup is done. Thanks again for the help!

Ok, I figured out why the color seemed to shift. It turns out the color is NOT shifting along the length. It’s because the RGB elements are positioned within the pixel such that they occlude each other at certain angles, causing one side to shine greenish and the other side to shine blueish. So the left and right sides appear different where they shine on the wall. Easy enough to dial back in code.