New 2D Mapping Tool

Hi All,

I’m doing the lighting for a series of small parties and every time the physical layout of the LED beams is different.

Mapping 1000+ LEDs in Excel is a pain, so I came up with a little tool that makes it very easy to map straight rows of LEDs, arbitrary shapes and single LEDs (like wizard’s tool).

The tool probably still has a bunch of bugs since it’s pretty much just a prototype, but it is quite usable already.

You can give it a try here: http://ledmapper.spoodoolabs.com

(Please note that it doesn’t work with touch input in a mobile browser, but this might change in the future)

The buttons above the canvas allow you to load a background image, save a map to a text file or load an existing file, and adjust the size of the underlying grid.

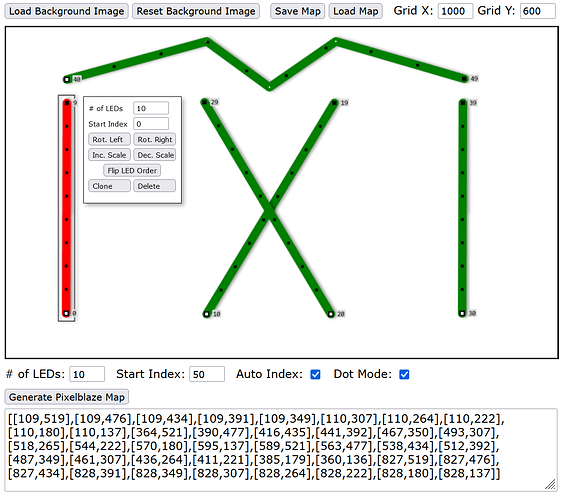
There are 2 different ways to draw LEDs. In the default mode you can simply draw arbitrary shapes straight onto the canvas.

The 2nd mode can be activated with the “Dot Mode” checkbox. In dot mode you create the desired shape by clicking on the canvas to define the vertices that make up the shape. Confirm the shape with a right click.

The small white dots on the lines are the vertices that make up the line (can be seen in the zigzag line). The Black dots represent the LEDs. The first LED in each shape has a slightly bigger black dot with a white center.

You can define the start index and number of LEDs beforehand via the “# of LEDs” and “Start Index” fields, or after drawing. When you click on a shape you enter the edit mode. From there you can rotate and scale it, adjust the start index and number of LEDs, flip the LED order, clone it, delete it, move the whole shape around or drag the individual vertices that make up the line in order to change the shape. Furthermore, you can right-click on a vertex to remove it or right-click on the line between two vertices to create a new vertex in the middle.

There is also an option to automatically adjust the start indices of consecutively drawn shapes. This can be activated with the “Auto Index” checkbox.

Once you are done with your map, click the “Generate Pixelblaze Map” button to create the map that you can then copy over onto your Pixelblaze.

This is an ongoing project so there will be changes along the way, but please give it a try and let me know if you encounter any bugs or if you would like to see any other features.
7 Likes

Oh man, this is amazing! Will play around with this. Thanks for making and sharing!

1 Like

One feature request is having something like shift to snap to 45 degree increments for lines.

Is this website broken? I get an error with that URL

It’s fixed now :+1:

20 characters…

Beautiful and elegant! Thank you!

Hello @DanielS … If one wanted to upload an existing set of mapped coordinates to the tool is there a format one can follow? Thank you!

Hey @martyzorro! Until now, importing data into the tool hasn’t been straightforward, as it required that complex format that the export-function produces.

But I just made some changes, and now you can simply upload a text document with xy coordinate pairs on separate lines, like this:

123,456
234,345
...

This should make data imports much easier!

PS:
-This very simplistic data format won’t be able to produce lines, just individual pixels.
-Check the Auto Index checkbox if you don’t want to assign indices manually.

Thanks! I tried this several ways and everything I upload is very compact in the upper left corner. Is it because I have a fair amount of negative X and Y coordinates? And the Pixelblaze map output doesn’t match what I’ve uploaded. Ideas? Thank you in advance!

By default the grid that you see on the screen has a size of 1000 x 600 with 0,0 being in the top left corner.

Negative coordinates in the uploaded text file are a problem though, since those would end up outside of the viewport. Could you just translate all the coordinates to the right and down until they are all positive?

I might implement a function to either do the translation in code or center the grid around 0,0 but that is gonna take a bit.

Do your coordinates need to be centered around 0,0 or could they be translated to the positive quadrant?

I have changed a few things again…
Your uploaded coordinates will now be centered in the grid.

If the pattern is too small then please adjust GridX and GridY accordingly after the coords have been loaded.

There are still a few quirks but it should work for now.

Nice, I think I got most of it to work as you were modifying, thank you. One more question: what does it do when the coordinates have decimals, and how many places is too many? Thanks!

Huh, you managed to produce floats in the map output?

AFAIK Pixelblaze works with 16bit floats for the map coordinates, so it really shouldn’t matter.

Sorry, I wasn’t clear - I meant decimals in the input. I noticed the map output put out only whole numbers.

By default floating point numbers do get rounded for the map output.

I just added a new checkbox called “Precise”, which will give you 2 decimals.

1 Like

I think I’m getting the hang of it, thank you very much!

1 Like