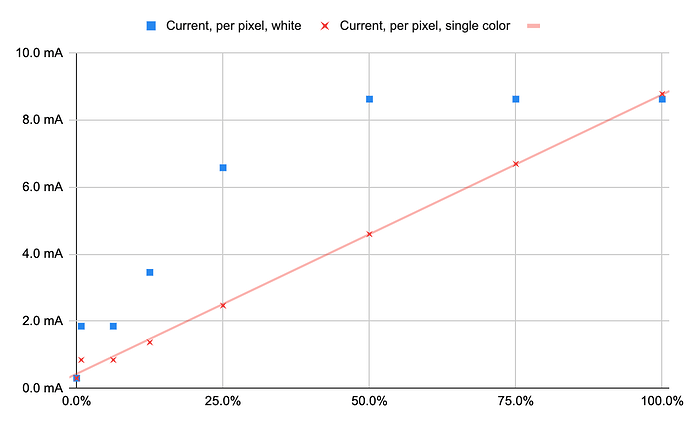
(Important Edit: While the data is correct, I made a mistake in the way I was interpreting these results. I originally claimed this was more efficient than other 12V pixels, but I’ve realized this is not true; They’re actually less efficient than other 12V pixels with the worst behavior happening at 50% white. They are similar to other pixels such as the WS2815, showing linear single-color current-vs-intensity performance. They also draw the same current at max white as when a max red or max blue is commanded, like a WS2815. The difference is that a WS2815 has a more linear current vs intensity curve (the curve for white is also linear, closely matching the curve for red, green, or blue), whereas these appear to be additive like a 5V pixel and max out current consumed at 50% white even though the observed white intensity does get brighter as you progress from 50% to 100% commanded intensity.
Sorry for the mistake, and thanks to Sam for asking a clarifying question via PM that made me realize my mistake (FYI @TheMariday). Though nobody called me out here, I’ll make it up by posting a graph of WS2815s and GS8208s later so we can all benefit from the data and a corrected interpretation. Note that the data and graphs were correct, just my interpretation (and conclusion that these had “better” efficiency characteristics) was unfortunately in the wrong direction. For completeness I’ll confirm I have no affiliation with the manufacturer/distributors.
CORRECTED/UPDATED POST:
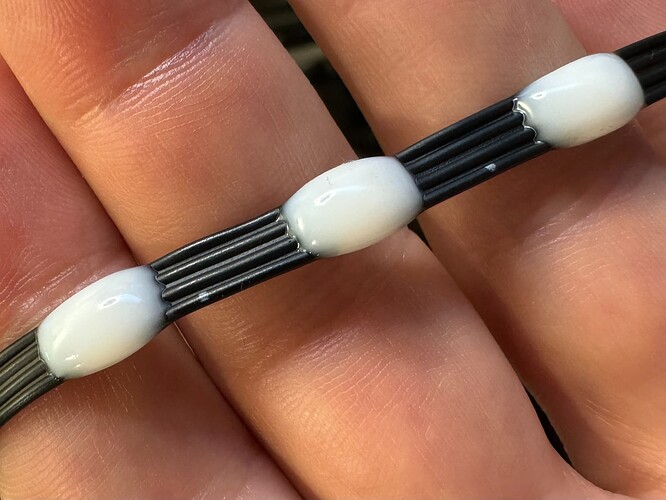
These 12V WS2818 Pebbles are curious different than WS2815 and other 12V pixels, perhaps in an undesirable way as it comes to lumen-per-watt efficiency as we all seek better pixels for our wearables that will stay bright without draining portable battery packs.
I did some detailed measurements. I was attracted to the backup data line (these are a 4-wire unclocked 12V pebble). I tested a 4m string of 50/m with a bench supply, powering the controller independently.
What makes these interesting (other than the pebble form factor and backup data line) is how they seem to consume current differently.
In a WS2815 and many other 12V pixels, the current consumed for a given commanded white intensity is the same as that for a single R,G or B intensity. These are different in that the seem additive up to 50% white.
They visually hold full brightness white output down to 7.8 V (vs 9V for WS2815), and then dim with a slight cyan-shift until they finally cutout cleanly at 5.7 V (vs my WS2815s, which begin to flicker and pass bad data at 5.7V).
I learned in this exercise that 12V pixels don’t redshift when they drop voltage; if anything the ones I’ve tested exhibit a noticeable slight cyan-shift as the voltage drops below 8V.
Data
Here’s my spreadsheet of test results:(https://docs.google.com/…/1SBXgUCVfZ8oQJ5tPbGCZ…/edit….
Plot
Gamma
Unfortunately, the resulting observed intensity curve (to be corrected with a gamma curve applied) is as bad as most 8-bit pixels (other than the GS8208 with it’s excellent internal 12-bit output curve). This also results in the typical perceptually-uneven rainbows (red-to-orange is compressed, cyan is too wide).
Photos never seem to really do this justice, but you can see what I mean in the attached.


